Coatie3D
powered and supported
by 
Goal of Coatie3D project is the development of a 3D graph
drawer and viewer. The purpose of graph drawing is the identification
of a pleasant (3d) layout for a given graph.
Binaries and sourcecode may be found at: http://sourceforge.net/projects/coatie3d/
Here are some examples:
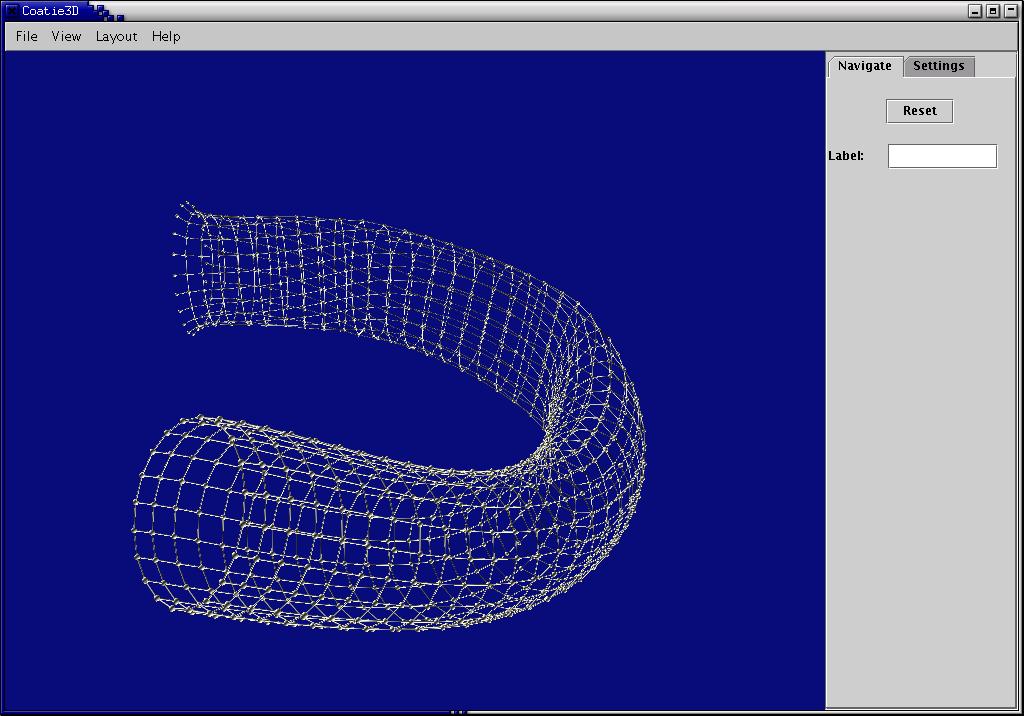
Graphs are visualized using a special version of Tunkelang's graph
drawing algorithm:
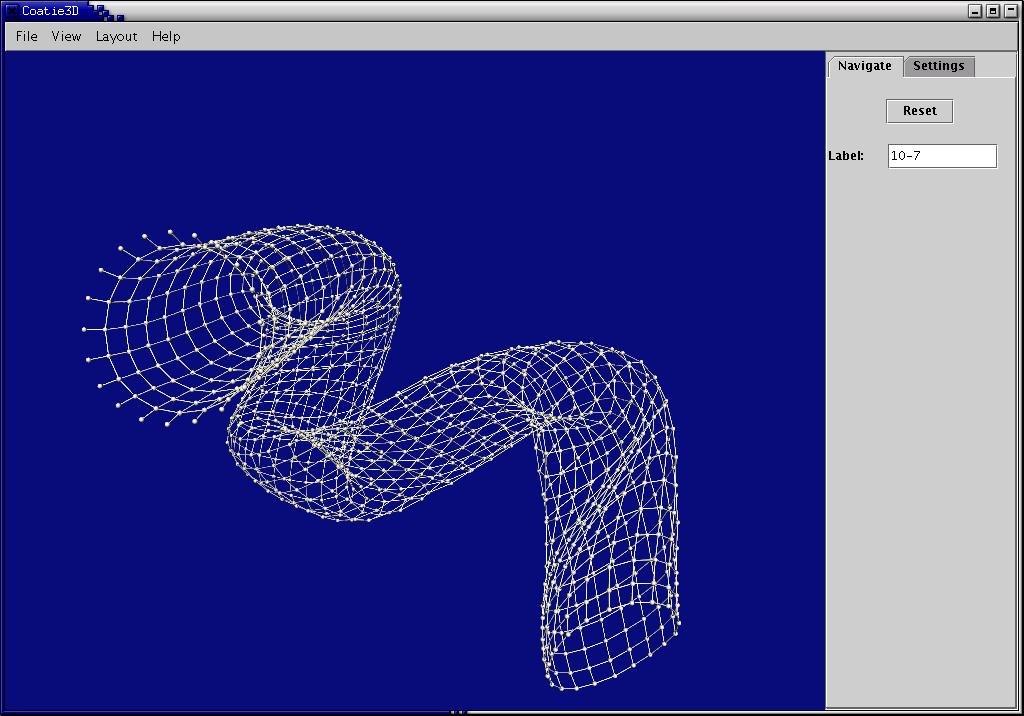
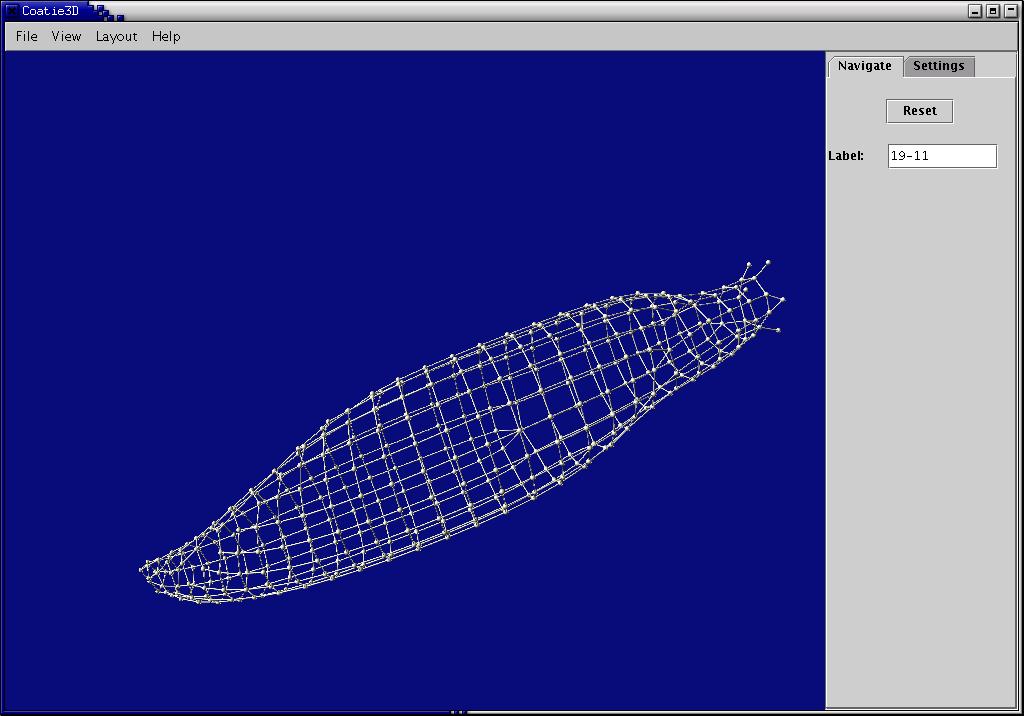
This allows for a fast and pretty good visualization of graphs:
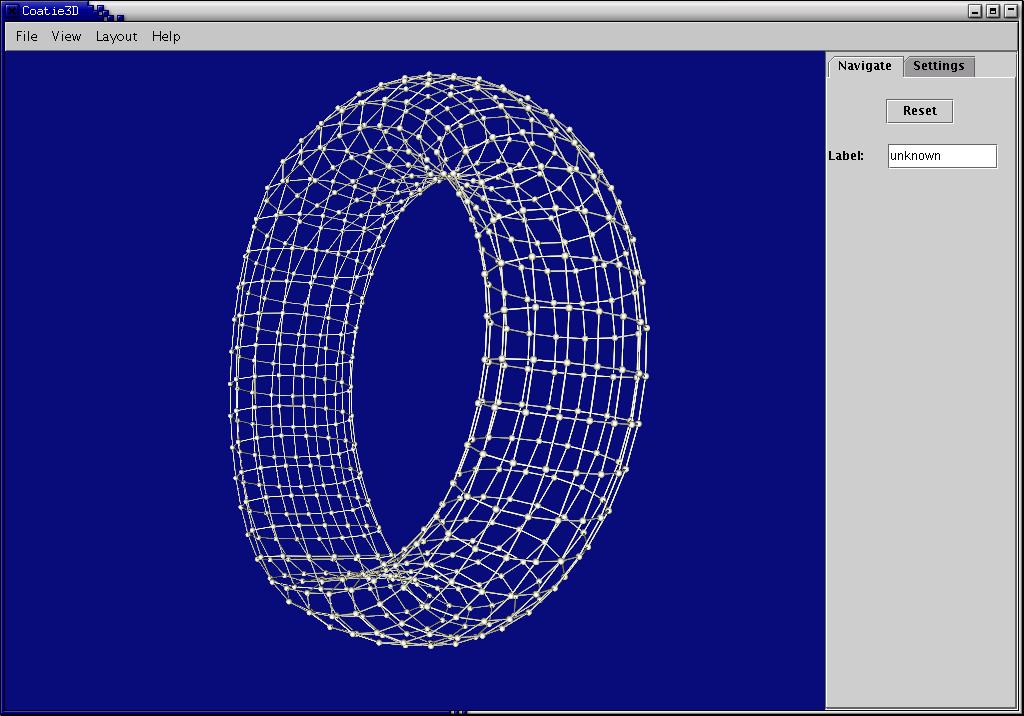
Like this....
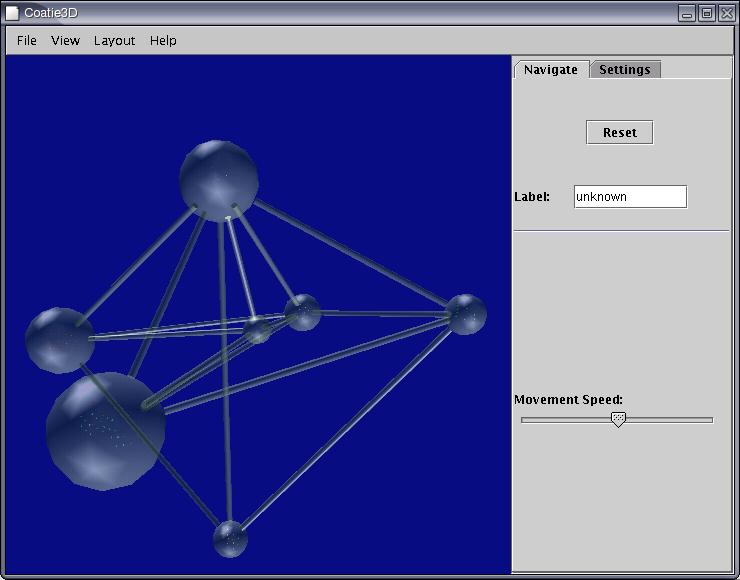
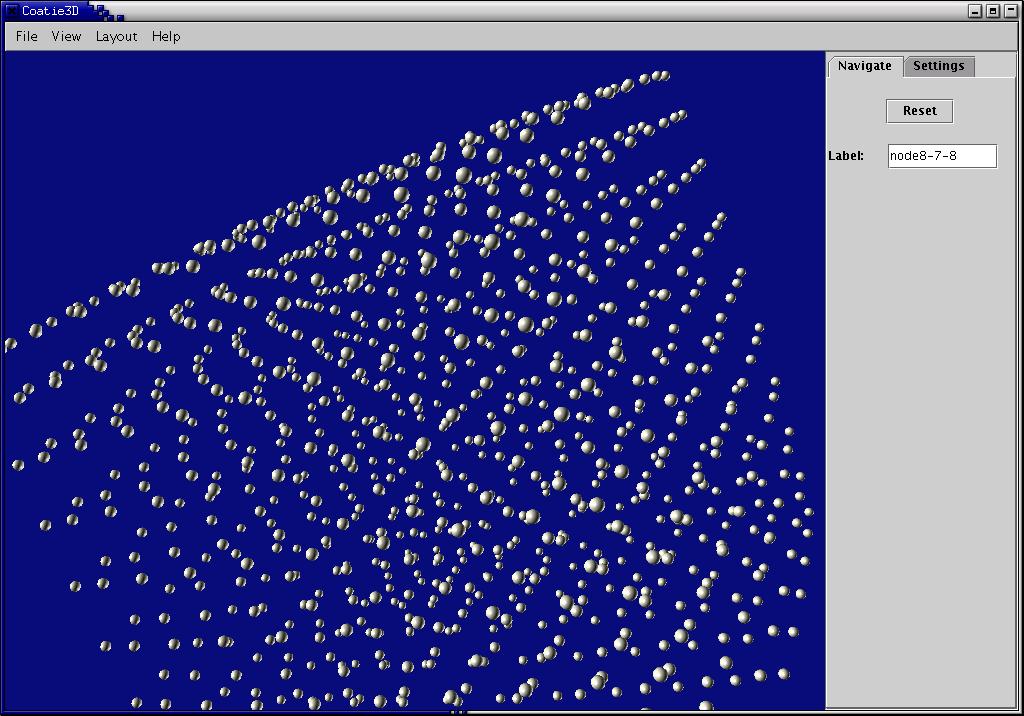
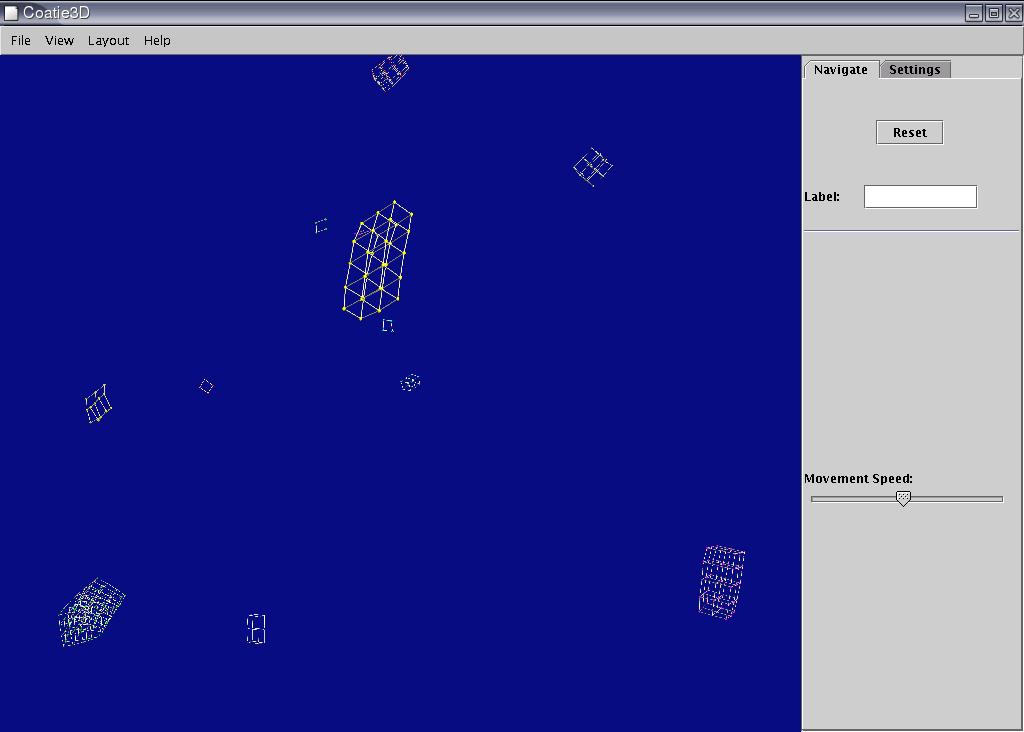
Nodes may be displayed using spheres or labels:
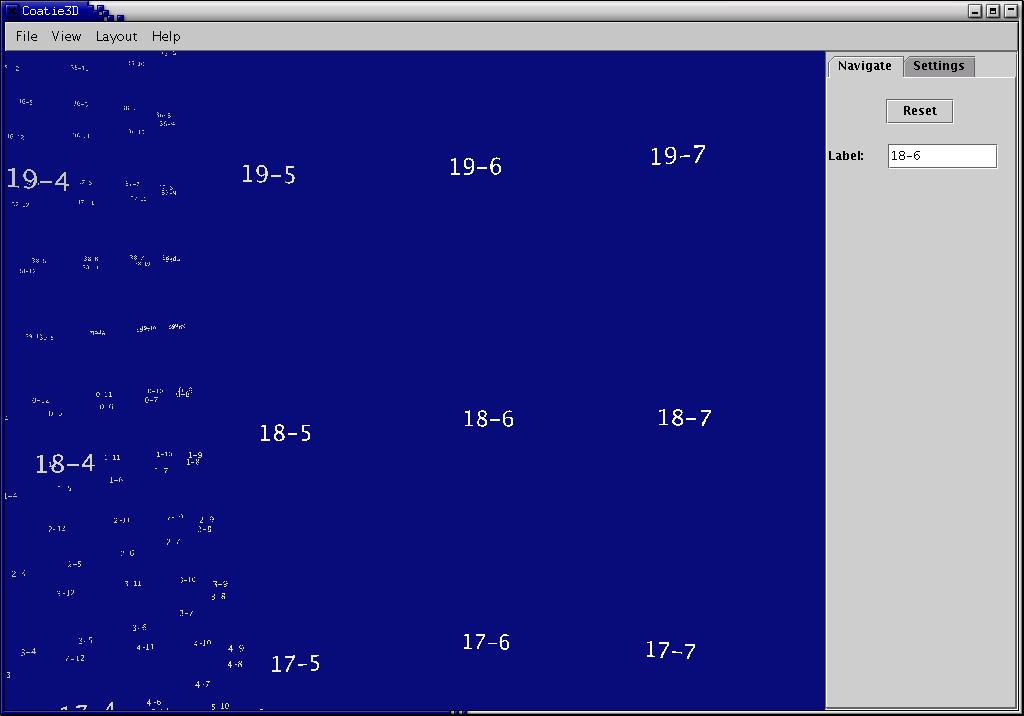
User may navigate through the graph using a comfortable GUI.
All graph drawing and clustering algorithm can be called from the
GUI or from the command line.
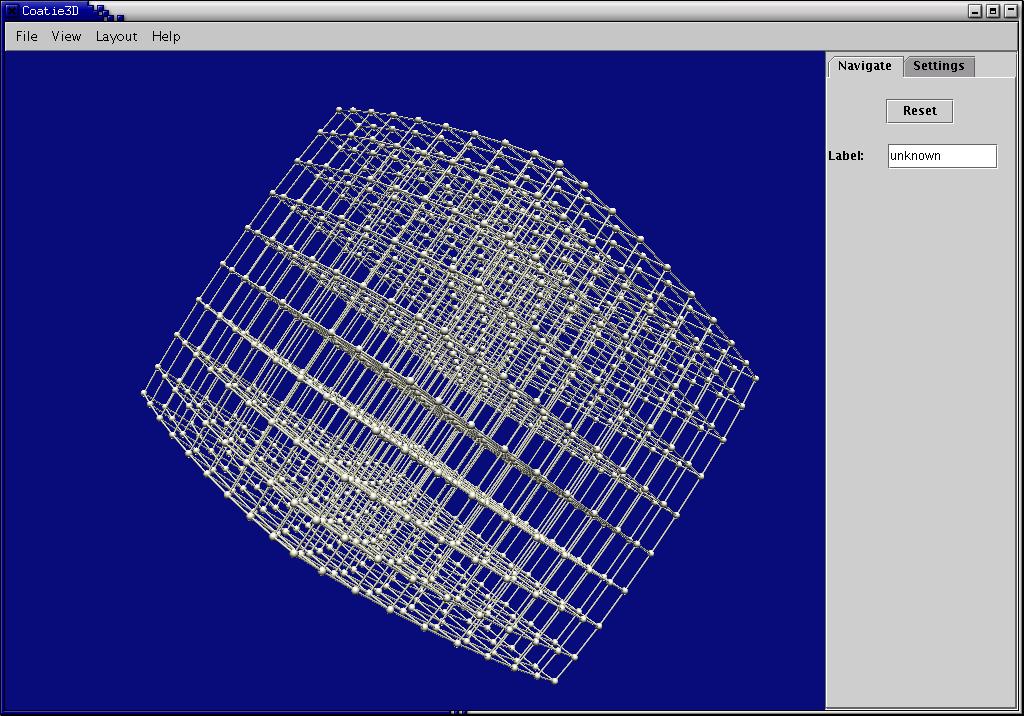
The octree data structure leads to a fast visualization of complex
graphs.
Graphs can be clustered using the well-known MajorClust algorithm.
This clustering information may be used to find a visualization which
emphasizes a graph's inherent structure. Alternatively the clustering
information can also be used to colour a graph's nodes:
Different ways exist to highlight clusters:
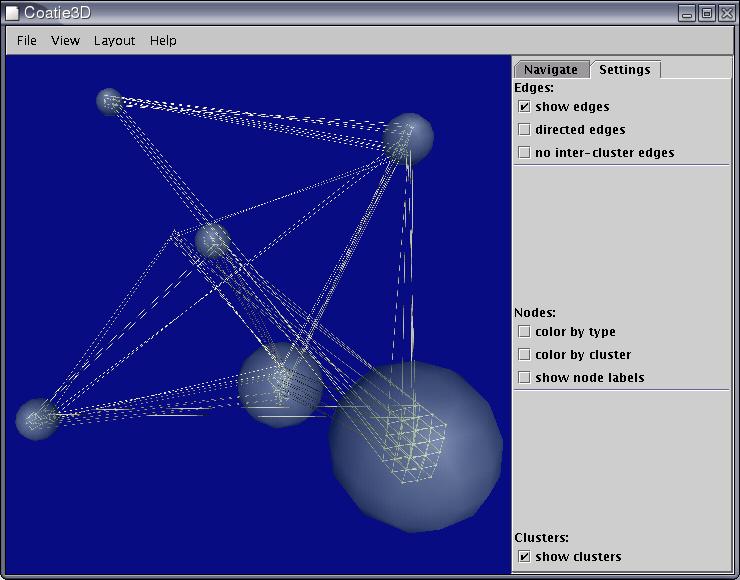
Graph structures, as identified by the MajorClust clustering algorithm,
are shown: